Thursday, August 31, 2017

The 10 biggest natural disasters in U.S. history

Since the beginning of civilization, natural disasters have been the scourge of man and women kind. From fires to floods, hurricanes to earthquakes, Mother Nature is often unpredictable, unmerciful, and deadly. Unfortunately, we've seen that recently as Houston and Texas struggles in the aftermath of Hurricane Harvey.

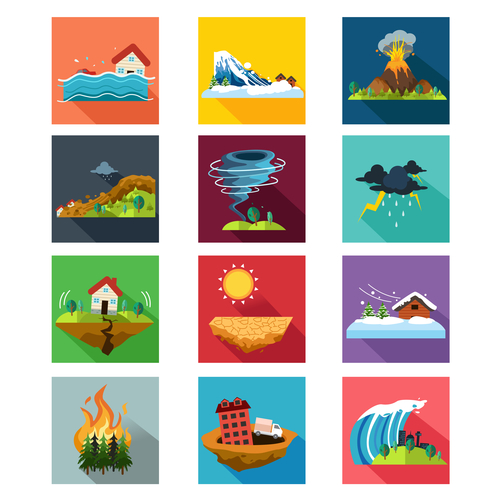
Here are the 10 biggest natural disasters in U.S. history, both by death toll and financial impact, listed by date:

Johnstown Flood - 1889
The town of Johnstown was a thriving steel mill community in the late 19th century…until disaster struck on May 31, 1889. After days of torrential rains hit, their South Fork dam finally gave way and burst, unleashing 20 millions tons of water with a 14-mile head start on the town. The fast-moving wall of water hit the town with the force of Niagra Falls, crushing 1,600 homes and killing 2,209 people.

Hurricane Galveston - 1900
The beautiful island community of Galveston – which was known as the “Jewel of Texas” – was the unfortunate target for a 1900 hurricane that turned out to be the single deadliest natural disaster in U.S. history. On September 8 that year, Not long after the city planners rejected a measure to build a sea wall to protect their city, a Category 4 hurricane swung into Galveston like a wrecking ball. With 145 mph winds and 15-foot waves, buildings and homes were pulverized, and the whole island was soon underwater, with 8,000 – 12,000 fatalities.

San Francisco Earthquake -- 1906
It only lasted less than 60 seconds, but then the San Andreas fault split during the middle of the night back in 1906, San Francisco was shaken to the ground and engulfed in flames. The 7.8 magnitude earthquake destroyed more than 80 percent of the city, but it was the ensuing fires that caused just as much damage. By the time the last ashes were doused, more than 500 city blocks had been burnt to the ground, 3,000 people had lost their lives, and 225,000 of the city's residents were left homeless.

Okeechobee Hurricane - 1928
When the newspapers and radio programs announced that a hurricane was set to descend upon Lake Okeechobee on September 16, residents of the Florida lake-front community evacuated their homes. But unfortunately, most people returned to their homes that evening when they thought the hurricane had passed – but it just was late arriving. They were beset by 140 mph winds and so much rain that the lake's dike broke, causing catastrophic flooding that wiped out 2,500 people, making it the second deadliest hurricane in U.S. history.

Dust Bowl - Early 1930's
Going way back to the midst of the Great Depression, a prolonged natural disaster was the last thing the U.S. people needed. But that’s exactly what they faced with the Dust Bowl – a decade-long drought that transformed the Great Plains from a lush, fertile farmland into a barren wasteland of dust and wind. The disaster was in-part due to man as well as nature, caused by farmers who severely over-plowed and mismanaged their crops, resulting in massive erosion that ruined the land.

When a ten-year drought ensued, the once rich topsoil was reduced to useless dust, and millions of people had to leave their homes and livelihoods to move elsewhere. Half a million people were left homeless, and a third of all farmers had to turn to government aid. The dust was so bad that windstorms sometimes blew the dust so far east that the skies darkened all the way on the Atlantic Coast.

Heat Wave of 1980
The death toll was just as high during a devilish heat wave during the summer of 1980, where the thermometer never went below 90 degrees for most of the summer. In all, 10,000 people died due to the heat factor, and the damage to the agriculture sector and other costs added up to $48 billion.

Heat Wave of 1988
It’s not just hurricanes, earthquakes, and flooding that cause disasters, as something as simple as high temperatures can turn deadly. In fact, heat waves have killed more people than any of the wind or rain-based weather events of the past 30 years in the U.S! Such was the case in the summer of 1988 when a record heat wave scorched about 45 percent of the nation, and rainfall levels were even lower than during the Dust Bowl era. Between heat stress, wildfire deaths, and other heat-related deaths, about 5,000 – 10,000 people lost their lives and the heat wave left $61 billion of damage to the agricultural economy.

Hurricane Katrina - 2005
The Category 1 hurricane that slammed south eastern United States ended up being the costliest natural disaster in U.S. history with a final tab of about $125 billion, including about $81 billion in property damage. But it was the unbelievable scenes of the levees breaking in New Orleans and the aftermath that affected us the most, as 80 percent of the city was underwater and countless people scrambling for survival. While that financial damage was unprecedented, it was the human toll of 1,836 lives lost that made it one of the worst American tragedies ever.

Hurricane Sandy - 2012
Seven years after Katrina hit New Orleans, Hurricane Sandy wreaked havoc in New York in 2012. Also known as Superstorm Sandy, the hurricane stretched an unnerving 1,100 miles across the Atlantic Coast. When it was all over, 44 people had lost their lives in New York and New Jersey and the financial damage – an estimated $70.2 billion - made it one of the most costly natural disasters in U.S. history.

Hurricane Harvey - 2017
Of course, news about Hurricane Harvey and the devastation it has caused in Texas is now worldwide. Starting as a Category 3 storm, Harvey increased in power into a Category 4 storm, with 52 inches of rain and winds up to 130 mph.

So far, 50,000 homes have been damaged or destroyed, there are scores of casualties, and 30,000 people are living in shelters. With at least 1/3 of the city of Houston completely underwater, early estimates account for up to $23 billion in damage.

Wednesday, August 23, 2017

Inside the world of landlords – attitudes, challenges, and fears of investment property owners

Currently, there are 111,532,119 renters in the U.S., with 2,654 new renters every day. But there are also 22,910,370 landlords or rental property owners in the U.S., which means 1 in every 14 or so people are landlords in America. 

While some may think that being a landlord is all sitting back and collecting profit, the reality couldn’t be further from that perception. In fact, landlords exercise a tremendous amount of time, risk, work, their own money, and even legal exposure.

But when done correctly, they ensure the win-win scenario of making a good investment AND providing a safe, comfortable, and nice home for deserving renters.

You’ll find hundreds of blogs about renters and the rental market, so today, we wanted to bring you a profile of landlords, including their attitudes, fears, and challenges with being property owners. I break these down into the categories of Tenant screening, Repairs & maintenance, Landlord stressors, problems, & fears, Profit!, The dreaded “E” word (eviction), and the Damage Deposit.

Landlord stressors, problems, & fears:
The #1 concern for landlords is non-payment of rent.

Only 51% of landlords say that being a landlord is more attractive or lucrative than it was a year ago, a shockingly pessimistic stat.

Even worse, 33% say that it’s less attractive or lucrative to be a landlord now compared to a year ago.

According to surveys, this is what stresses out landlords the most:

22% Loss of income
22% Troublesome tenants
16% Maintenance
13% Tenant evictions
12% Tenant turnover
10% General stress of the role
5% Staying on the right side of the law

A second survey yields similar landlord stressors:

18% High turnover of tenants
12% Tenants not paying rent
10% Keeping up to date with safety checks and
8% Keeping up to date with changes in legislation
5% Finding good tenants
5% Property maintenance
3% Time consuming

But when asked if they’ve ever had to deal with a problem tenant, 51% of landlords surveyed said “yes,” while only 49% had not.

Profit!
88% of property managers were able to increase rental prices in the last year.

In fact, rental properties now generate 31% of the average landlord’s annual income!

Homeownership rates are at a 50-year low, but at the same time, rental inventory is at a 20-year low, causing the average renter to spend 10.4 weeks looking for a new home or apartment!

California is ranked #4 (behind D.C., New York, and Hawaii) for states with the highest percentage of renters. In fact, 43% of California residents now rent.
88% of the property managers they surveyed increased their rental rates over the past year.

Tenant screening:
36% of landlords just “trust their gut” when screening renters, and not all run eviction reports or criminal background checks.

38% didn’t screen a particular potential tenant because they “didn’t raise any red flags.”

13% didn’t want to spend the money to screen tenants properly, and an astounding 21% of landlords just weren’t aware that they could screen tenants online.

But more than 95% of landlords say that tenant screening is beneficial – they just aren’t doing it or doing it right.

When screening prospective tenants, 59% of landlords felt that a steady income was more important than a solid credit history.

Another shocking revelation is that 66% of landlords would overlook a relevant criminal history when accepting a renter.

But only 56% of landlords would take a tenant if their credit was bad!

These days only 38.6% of renters have a credit score of 660 or above.

Unfortunately, many landlords set up their tenants to fail because they accept applications they shouldn’t (costing themselves a lot of money and aggravation in the process.)

For instance, 40% of potential tenants are cost burdened, which means they would be paying more than 50% of their income in rent, which magnifies the risk of late and missed payments.

Repairs & maintenance:
According to data, the most common (and costly!) maintenance problems for landlords include:
·      Smoke detectors
·      Water heaters
·      Getting keys organized
·      Pests like termites, ants, roaches, etc.
·      Furnaces and flues
·      Clogged sink drains and toilets
·      Electrical systems

When it comes to their opinion or renting a tenant with pets, landlords are just about split down the middle, as a pet can cause a lot of damage.

 In fact, 53% of landlords said that they would rent to a tenant with pets compared to 47% would not.

The dreaded “E” word (eviction):
The average eviction now costs landlords $3,500 and takes at least 3-4 weeks (past the month(s) of non-payment. However, if not handled correctly the first time or in extenuating circumstances, there have been cases where evictions cost the landlord up to $10,000!

Interestingly, new eviction filings spike in the summer months, specifically July, August and September every year.

The damage deposit:
54% of rentals have tenant turnover every year.

Landlords commonly have to withhold a tenant’s deposit because of maintenance issues, damage to the property, or other conditions. The common reasons include:

49% State of the garden/lawn/landscaping
15% Damage to fixtures and fittings
13% Cleaning
12% Rent in arrears
1% Damage to furniture
9% Other damage


***
If you have any questions about purchasing a rental property, being a landlord, or even how  a property management firm can help you, feel free to contact us.

Wednesday, August 16, 2017

Exposing common real estate, housing, and rental scams. (Scams #6-10)

Real estate scams are a lot more prevalent than you may think, and California is home to four out of the top ten zip codes ( and ten out of the top 25) when it comes to real estate criminals and fraudsters.

In fact, each year, billions of dollars are siphoned off illegitimately by criminals who set out to sham the real estate, mortgage, and housing system.

The FBI reports that guilty parties include Realtors, mortgage brokers, loan officers, lenders, appraisers, underwriters, accountants, attorneys, land developers, investors, builders, bankers, escrow and title employees, and plenty of landlords, renters, and plain old lawbreakers.

In part one of this series, we exposed five common real estate and mortgage scams, In this blog, we bring you scams no. 6-10.

6. Last minute closing scam
This scam takes advantage of the stress, confusion, and time-crunch many home buyers feel towards the end of their transaction. The first step is for hackers to tap into the email account of a real estate agent, broker, transaction coordinator, or title company (that’s a lot easier than you think!)

Next, they get the names, addresses, contact numbers, and other pertinent information for the homebuyer in the transaction. The night before the closing - or at some critical juncture at the 11 1/2 hour before the home closes – the buyers will get a phone call at home from someone from the title company.

They inform the buyers that there's been some minor change or some bit of accounting needs to be cleaned up. Maybe they have to submit a new deposit, closing cost amount, or even were overcharged and will be getting a refund check back, but either way, the caller gives them new wiring instructions or gets their bank account information.

The only problem is that the title representative on the phone actually was the con artist, and by the time the buyers call their real estate agent or title company the next day to check in or get an update, their bank account has been cleaned out and their purchase funds are long gone. Ouch!

7. “I’ll sell your home or buy it myself” scam
I’m sure you’ve seen signs saying just this – usually on the side of the road or a corner in a marginal neighborhood. While the real estate agent/company making this offer may not be trying to steal from you per se, they know the offer is a glorified scam because no one is ever going to buy your house themselves…never…ever.

Instead, they use it as an unscrupulous marketing gimmick just to get more listings and home buyers.

When you call the number from that sign, you probably won't even reach a licensed real estate agent. But if you do, they'll come out to your house and have you sign an unusual listing agreement that includes an asking price determined by the agent which home buyers would NEVER agree to, nor would it appraise.

They will also have you sign off on pre-determined price breaks and a contract that you will use this agent only to buy a house – and maybe even a house only from a pool of the company's other listings.

Very quickly, that dream offer turned into a nightmare for home sellers.

8. Renting a vacant house
This one of the oldest and most prevalent real estate scams, and its attraction for criminals is its simplicity. The con artist will drive by a vacant home, whether it's foreclosed, already for sale by an absentee owner, a vacation home, or just unoccupied. They kick in the side door or come in through a window and then change the locks immediately.

Now that they have possession of the home, they only need to change the sign in the front yard to "For Rent" with their number, as well as list in as a rental on Craigs List. They advertise the home at a discounted rent to create a lot of interest, and take scores of applications.

The plot thickens when every one of these applicants gets a call back with the good news that the house is theirs to rent – but they need to come up with the first month's rent and security deposit ASAP to hold it.

Hypothetically, with twenty applicants giving $3,000 each, you can see how the con artist can produce a large amount of cash in a short time. Of course, when the renters – all twenty of them – show up to move in, they'll find the house vacant again and the criminal long gone with their phone number disconnected.

9. Title fraud
While it may be less common than simple rental and real estate scams, title fraud is one of the most dangerous – and costly – of all housing crimes. In this scam, the con artist falsifies documents to prove that they are the legal and rightful owner of a home or plot of land. It's not hard to do, as public records will supply all of the information and documents they need to replicate, and a computer with Photoshop will do the rest.

Once they have these new title documents, the fraudster can use them in a variety of ways to commandeer cash. Many times, their scheme entails applying for a mortgage loan for the property such as a Home Equity Line of Credit, cash-out refinance, or private "Hard Money" loan. Of course, they'll take all of this cash, but leave the rightful owner confused and shocked when they get notifications for payments overdue.

10. Foreclosure bailout scams
There are many grifts, rackets, and hustles that fall under the wide umbrella of foreclosure bailout scams, which spread like wildfire during the real estate crash and Great Recession.

These can focus on the mortgage side of home ownership, like shady mortgage renegotiation companies that collect big amounts of up-front money but get little or no results, bogus forensic loan audits, or other loan assumption scams.

There are also plenty of criminals and unlawful firms that will take advantage of stressed and desperate home owners who are facing foreclosure. Often, these scammers pretend to be affiliated with a legitimate governmental foreclosure agency, like HUD, NeighborWorks, the Home Affordable Modification Program (HAMP) or the Home Affordable Refinance Program (HARP). Just by sending letters on their letterhead, sending emails or cold calling these homeowners – all easily trackable on public lists of defaulting mortgages – the con artists have an opening.

From there, they may entice the trusting homeowner into offering fees for service, making mortgage payments to them directly, offering a short sale that is really just another scam, or even signing over the home.

They also may claim to have an angel investor or foreclosure bailout program that will buy the home from them and then lease it back to them, which the homeowner loves because it means they don’t have to move and can win back their home. However, after six months to a year of making high monthly lease payments, they realize that the home is still going to foreclosure and the “investor” did nothing more than pocket their funds and not make payments to the bank.

***
The bottom line is that you should be informed, verify who someone is when they contact you, stay in very close communication with your legitimate Realtor, loan officer, and title company, and report any activity that seems fishy! Contact us if you would like any more information about real estate and mortgage scams – and how to avoid them.


Friday, August 11, 2017

The state of the luxury real estate market: 2017-2018 and beyond

You've probably seen articles, news features, and social media posts about our red-hot real estate market lately. But rarely do they talk about the luxury market specifically, leaving buyers and sellers of high-end, million dollar, and luxury homes in the dark. So we thought we'd present you the most complete, accurate, and up-to-date data on the luxury real estate market. 

Sales of luxury homes have skyrocketed in 2017, with Q2 sales up 7.5 percent from just one year ago, with the average luxury home selling for $1.79 million across the U.S.

This also marks the first time since 2014 or before (that’s the year they started tracking this specific data) that luxury home sale appreciation has outperformed the appreciation for all home sales.

Basically, the top 5 percent of most expensive homes are selling more robustly than the bottom 95 percent!

According to industry data, which defines a luxury home as one in the top 5 percent of most expensive homes in each city, the luxury home market has experienced a transformative shift, from a lagging and stagnant sector of the housing market to the forefront of activity.

But it seems to be the low-end of the luxury market (so to speak) that’s thriving the most. Sales of homes with a price tag of $1 million or more are up 22.2 percent from last year, while sales of homes priced at or above $5 million are up 19.6 percent.

Despite these price increases, sales volume is down. In fact, the number of listings priced $1 million or higher have dropped 9.4 percent compared to one year ago, and those in the $5 million and up price range have fallen about the same percentage.

That indicates an inventory shortage in the luxury market (mirroring the overall real estate trend), reversing a glut of double-digit inventory growth for five consecutive quarters prior.

Experts point to several factors that have contributed to this state of luxury home sales.

For one, there is a historical precedent that when the stock market is booming, the luxury home market does exceedingly well. But the biggest reason for the luxury market’s renewed vigor may be a change in the mindset of sellers. Analysts point to the theory that owners of million dollar-and-up luxury homes were flat out setting listing prices that the market wouldn’t bear.

Looking to cash in on the greater market’s steady climb, luxury listings were priced higher than buyers were willing to spend. Collectively, that resulted in fewer luxury home sales, greater Days on Market, and general price depreciation. But almost en masse with the start of 2017, sellers have gotten more realistic, reducing prices to levels more attractive to luxury home buyers.

Once luxury listings began to close, that created a supply shortage that further invigorated the market.

The result? The floodgates are open on high-end, million dollar plus, and luxury listings like we haven’t seen since perhaps before the real estate crash and recession.

While luxury listings may be selling like hot cakes, it's still a market dictated by buyers – and what they're willing to pay. Consider that only 1 in 50 luxury homes sold above list price in the Q2 of 2017 (compared to at least 1 in 4 homes that sold for above asking price in the bottom 95 percent).

How about the luxury market in California?

During the January to March first quarter of 2017, 10,562 homes sold for $1 million or more in California. That represents an 11.7 percent year over year increase and also the highest number on record for a first quarter.

During that same time span, 2,523 homes sold for $2 million or more, which is an 11.8 percent increase from the same period last year and also a record.

Irvine, California led the entire nation for year-to-year price appreciation in the luxury real estate market, with an astounding 37.4 percent increase over this time last year, to an average sale price of $3.5 million.

Long Beach, California and nearby Reno, Nevada saw price increases of over 25 percent for luxury homes, too.

The five zip codes with the highest number of million dollar or greater home sales last quarter were 92620 (Irvine); 92130 (San Diego, including Carmel Valley); 95125 (San Jose); 92037 (La Jolla, San Diego); and 92651 (Laguna Beach).

About 78 percent of the $1 million and up home sales were existing (not new) homes; only about 11 percent were condominiums, and 31 percent of all $1 million and up sales were cash purchases.

***
Do you have questions about buying or selling a luxury home or would like more information? Contact us any time.


Wednesday, August 2, 2017

Signs, signs, everywhere signs (of the real estate market)


Signs, signs, everywhere signs, 
blockin' out the scenery, 
breakin' my mind
Do this, don't do that, 
can't you read the signs?

So goes the old 1970s song originally by Five Man Electric Band but redone by Sacramento's own Tesla in 1990. Those lyrics certainly still apply not only to highway billboards and guide posts along old country roads, but also signs of things to come in just about every aspect of the economy. In fact, there are signs we can look for that will tell us if the market is on the rise or ready for a slight decline; a seller’s or a buyer’s market.

Of course, home sales don’t act in a vacuum and things never line up perfectly, so some cities or regions may show several conflicting signs at the same time. But, in general, by tracking certain telltale data, we can see trends in the real estate market and know when it’s a smart time buy, sell, or invest.

Signs of a hot (sellers) market:

1. Buyer demand is high, especially in the starter and mid-price ranges.

2. At the same time, housing inventory is low, feeding demand.

3. Based on that combination, sales keep closing at steadily rising prices.

4. Houses don’t stay for sale long, with Days on Market low and dropping.

5. The volume of home sales is higher than average and increasing.

6. You’ll see multiple and competing offers on many listings.

7. Sellers offer few amenities, credits, or incentives to buyers.

8. You see few price reductions, as home usually sell at or above asking price.

9. Realtors see a lot of traffic on their listings, including on-line and in-person visits.

10. In fact, the release of new listings are often an event unto themselves!

Signs of a cooling (buyers) market:

1. Unlike a seller’s market, you’ll actually see increases in the housing inventory available.

2. The Days on Market climbs steadily as homes don’t sell nearly as quickly.

3. Even when priced right, sellers see fewer offers on their listings, and far less bidding wars or competing offers.

4. Listings get less online and in-person views, and there is far less traffic at open houses.

5. Increasingly-desperate sellers start reducing prices at a greater rate.

6. They also start offering more incentives and credits to attract and appease potential buyers.

7. Bucking the trend of ever-escalating prices, new listings are priced at the level of recent closed sales or even lower.

8. Homes also sell for a smaller percentage of their original list price.

9. Due to decreasing demand, the volume of sales starts to lag.

10. Real estate ads get bigger, louder, and more extravagant!

Like we mentioned, these are just signs that point to a destination, but there are many stops along the way. Somewhere in between a white-hot seller’s market with fast-climbing prices and a stagnant buyer’s market with price declines sits many degrees of more balanced markets.

Here are some signs of a balanced or neutral market:

1. Inventory levels are normal compared to previous years.

2. There is no excess or surplus of housing inventory, with three to six months active inventory considered a normal range.

3. New listings are priced at or near prices of recently closed listings.

4. Sales volume is consistent and typical with the same season in previous years.

5. Median sales prices have stabilized, which can mean a normal negative or positive range with no huge spikes or valleys in prices.

6. Homes that are priced correctly sell within a typical 30 to 60 days, but Days on Market aren’t abnormally high or low.

7. Real estate ads (and blogs!) are a little smaller and less loud again!

Of course, Sacramento is in an extremely hot seller’s market right now, with a huge inventory crunch, rampant demand following redevelopment in the region, low interest rates, steep competition for buyers, and rising equity for sellers and homeowners.

But in the coming months and years as the market goes through normal and healthy seasonal and market corrections, you’ll be able to identify some of the signs along the way!